PlaniqVisual roadmaps & research trees
Build directed graphs to map out your projects, research paths, and workflows. Connect tasks, track progress, and collaborate with your team — all in a visual DAG canvas.
What Planiq does
Public Boards
Flip one toggle and any board becomes a read-only link — no login, no install for viewers.
Send stakeholders the URL, not a screenshot.
AI Extend
Ask the model to fan out next steps from any node, in your project's voice.
From blank canvas to mapped plan in seconds.
Drop-in Attachments
Drag any file straight onto a task. Quotas scale with your plan up to 1 TB.
Briefs, mocks, specs — pinned where the work happens, not buried in chat.
Real-time presence
Live cursors, instant graph mutations, conflict-safe edits over WebSockets.
Your team plans together at the speed of conversation.
Board chat
Channels, DMs, mentions, emoji reactions — scoped to each board.
Decisions stay next to the work, not buried in another tool.
Time tracking
Per-task timers, manual entries, exportable CSV reports.
Bill clients and forecast capacity from a single source of truth.
Developer API
REST endpoints documented by OpenAPI, auth with rotatable pq_live keys.
Wire boards into CI, Slack, or anything that speaks HTTP.
AI Board Summary
One click and the model digests the whole graph into a status brief.
Walk into the standup with the report already written.
How Planiq works
Create a board
Start with a blank canvas. A board holds one project, research effort or team workflow — private by default, shareable when you choose.
Map work as a graph
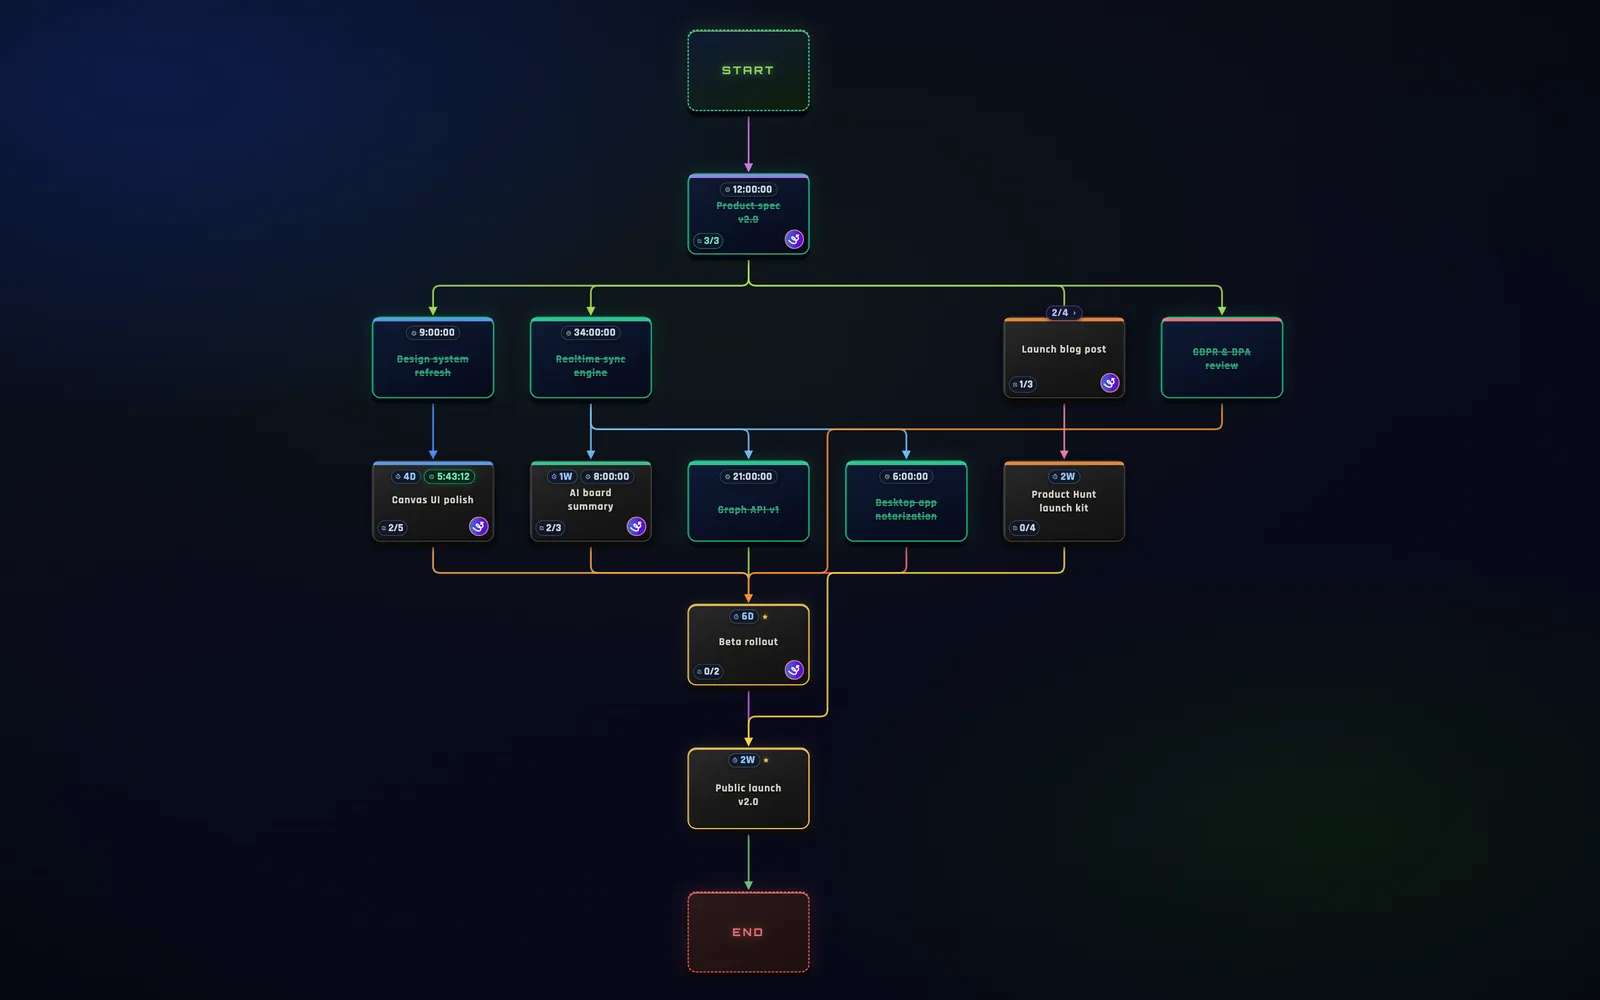
Add tasks as nodes and connect what depends on what. Branches, parallel tracks and dead ends stay visible instead of being flattened into a list.
Track it in real time
Set deadlines, log time, chat on the board and let the AI assistant extend or summarize the plan. Everyone sees the same live picture.
See the whole plan at a glance
Who Planiq is for
Product teams
Roadmaps with real dependencies: see which work unblocks the launch, not just what sits next in a backlog.
Research & engineering
Exploratory work branches. Map hypotheses as a tree, prune dead ends cheaply and keep progress legible to reviewers.
Agencies & freelancers
Share read-only boards with clients, track billable time per task and export reports — all in one place.
Why a graph, not a list
Most planning tools flatten projects into rows. Real projects are not linear: design, infrastructure and legal work proceed in parallel and converge; research forks when a result changes the plan. A flat list hides exactly the structure you plan around.
Planiq models a plan as a directed graph — a DAG. Every task is a node, every edge means "must come before". Critical paths, bottlenecks and parallel tracks become something you can see and rearrange, not bookkeeping in someone’s head.